
October 15, 2006
How to debug T-SQL stored procedures
I will execute -- or step into -- a sample T-SQL stored procedure and assign values to input parameters, inspect variable contents, follow the logical flow of the procedure during runtime, evaluate T-SQL expressions, view the procedure's output, set breakpoints and generally examine the state of the environment. (Future tips will continue along this same theme.) We will debug our procedure, not from Management Studio but from the Visual Studio 2005 development environment. I mention this because under SQL Server 2000 we are able to debug stored procedures using Query Analyzer. Perhaps debugging capabilities will be added to Management Studio in the future.
- Sample stored procedure
- Where to start debugging the stored procedure
- How to step into or run the stored procedure
- Visual Studio debug windows
- Conclusions
Sample T-SQL stored procedure: P_DisplayProductDetails
Our sample stored procedure displays product details from the AdventureWorks database using a function to rank the unit price for each product subcategory. The procedure accepts the category name as an optional input parameter. Several output parameters feed useful information back to the calling batch.
Use AdventureWorks
GO
IF EXISTS (SELECT * FROM sysobjects WHERE type = 'P' AND name = 'P_DisplayProductDetails')
DROP Procedure P_DisplayProductDetails
GO
CREATE Procedure P_DisplayProductDetails
(@Categoryname varchar(50) = NULL,
@MatchingRows int = NULL OUTPUT,
@ErrorString varchar(128) = NULL OUTPUT,
@ErrorNumber int = NULL OUTPUT)
as
BEGIN TRY
-- Append a % so our callers don't have to know exact subcategory names
if @CategoryName is null
select @CategoryName = '%'
else
select @CategoryName = @CategoryName + '%'
-- Use a rank function to rank data by List Price over subcategory name
-- The DENSE_RANK assigns consecutive rank values
SELECT Production.Product.ProductID,
Production.Product.Name AS ProductName,
Production.ProductCategory.Name AS CategoryName,
Production.ProductSubcategory.Name AS SubcategoryName, Production.Product.ListPrice,DENSE_RANK() over (Partition by Production.ProductSubcategory.Name ORDER BY Production.Product.ListPrice DESC) as PriceRank
FROM Production.Product
INNER JOIN
Production.ProductSubcategory ON Production.Product.ProductSubcategoryID =
Production.ProductSubcategory.ProductSubcategoryID
INNER JOIN Production.ProductCategory ON Production.ProductSubcategory.ProductCategoryID = Production.ProductCategory.ProductCategoryID
WHERE Production.ProductCategory.Name like @CategoryName ORDER BY Production.ProductCategory.Name
select @MatchingRows = @@ROWCOUNT
return 0
END TRY
BEGIN CATCH
-- LOG THE ERROR … WE MAY WANT TO SKIP THIS STEP WHILE DEBUGGING !
insert dbo.Application_Error_Log (UserName, errorNumber, errorSeverity, errorState, errorMessage) values (suser_sname(), ERROR_NUMBER(),ERROR_SEVERITY(), ERROR_STATE(), ERROR_MESSAGE())
SELECT @ErrorNumber = ERROR_NUMBER(), @ErrorString = ERROR_MESSAGE()
RAISERROR (@ErrorString, 16,1)
END CATCH
Where to start debugging the stored procedure
Before any debugging can take place, you first must create the store procedure. This can be done either by using Management Studio/New Query or by building the procedure graphically in Visual Studio 2005. Stored procedures can be created in Visual Studio by opening a new database project and using the Visual Studio Installed Templates.
Either way, once the procedure exists, you are ready to start debugging from Visual Studio 2005. When you start up Visual Studio for debugging purposes, you don't have to create a project. Instead, you can create a connection to the AdventureWorks database from Server Explorer, as I have done in the screenshot shown in Figure 1. (You will have to provide your server name along with your login credentials and choose the AdventureWorks database.) Then you can drill down and open up the stored procedures folder. Next, right click on the procedure you wish to debug and choose Step Into Stored Procedure from the context menu. Then you are ready to start debugging!
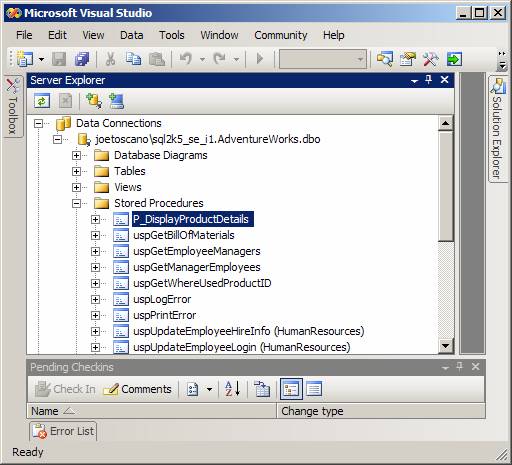
Figure 1: Where to start debugging in VS 2005
How to run the stored procedure
By stepping into the procedure, you are essentially telling Visual Studio to start running the procedure line by line. Since our sample procedure does accept input parameters, you will see a Local Window that allows you to scroll through the local variables and parameters of the stored procedure. In Figure 2 under the Direction column header, you'll notice that Visual Studio identifies the output parameters for you, and the Value column is the only column in this window you can change. In this case, I've supplied Bike as a CategoryName value.
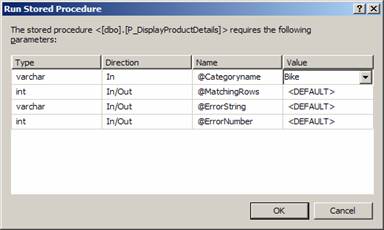
Figure 2: Output parameters
Visual Studio provides numerous windows in which to examine the state of the environment. The line of code waiting to be executed is identified by the yellow arrow in the screenshot in Figure 3.
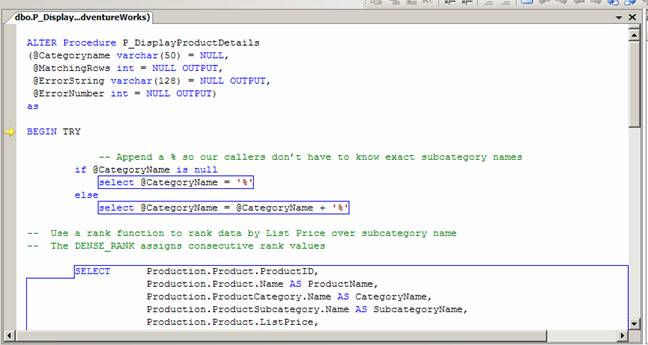 Figure 3: Code to be executed
Most of the time, you will Step Into or Step Over commands in your stored procedures. The commands below apply to a single T-SQL line:
- Step Into (F11): Use to single step through your code. (Move the yellow arrow down one statement.)
- Step Over (F10): Useful if you have lines of code that perhaps modify data or call other procedures that you don't care about while debugging. For example, you may want to skip code that performs auditing.
- Step Out (SHIFT-F11): Execute the rest of the stored procedure without pause.
- Run to Cursor (CTRL-F10): Position the cursor to a point in your code and then hit CTRL-F10 to execute all code up to that point.
- Continue (F5): Resumes execution until completion or until the next breakpoint (more on breakpoints in a minute).
Visual Studio debug windows
Visual Studio provides us with many informative debug windows. I'll walk through our sample code to review several of these windows, starting with the Autos window.
The Autos Window displays variables used in the current statement. When the yellow arrow points to the select @CategoryName = @CategoryName + '%' line of code, notice the value of @CategoryName is the value prior to the statement actually being executed. In this case, in Figure 4, we have yet to append a percentage to this parameter.
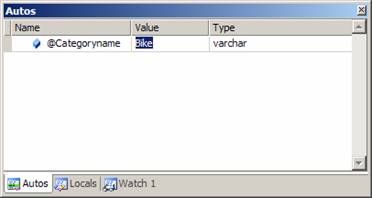
Figure 4: Autos window
The Locals window displays the current local variables and parameters and allows you to change the values of these variables interactively during code execution. This window color codes variable values that were changed. In Figure 5 you can see that I changed "Bikes" to "Clothing," and to identify this Visual Studio, I made this new value red.
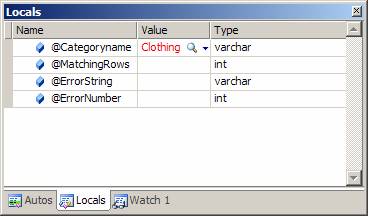
Figure 5: Locals window
The Watch 1 window allows you to type or drag from code the T-SQL Expressions to be evaluated in this window and see what the code actually evaluates. This may be useful if you want to investigate the values of expressions contained in conditional expressions, such as IF, WHILE or CASE. You can actually work with up to four watch windows.
The Output window displays the result set returned by select or print statements. In our example, we returned 35 matching "Clothing" rows (see Figure 6).
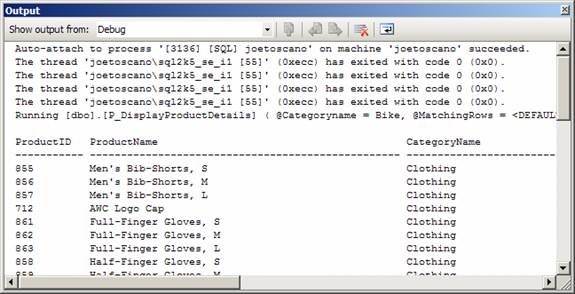 Figure 6: Output window
The Hovering Value window is not really a window, but it's a great feature worth pointing out. If you hover your cursor over your lines of code while in debug mode, you will see the values of variables associated with that particular line. This seems similar to the Windows application functionality in which you hover your cursor over a toolbar icon without clicking on it to get help.
The Breakpoints window displays your current breakpoints and allows you to add them. Breakpoints are user-defined code locations and/or conditions that pause execution, allowing the debugger to reflect, inspect and so on. You can add breakpoints by clicking to the left edge of the code window below, identified by the yellow arrow. Notice that the Breakpoints window in Figure 7 is actually divided into two windows. The lower window provides breakpoint information and tells us there is a breakpoint on line 20. The upper window of Figure 7 contains a code section. In this upper window we do see the red bubble to the left of line 20, which is Visual Studio's breakpoint indicator.
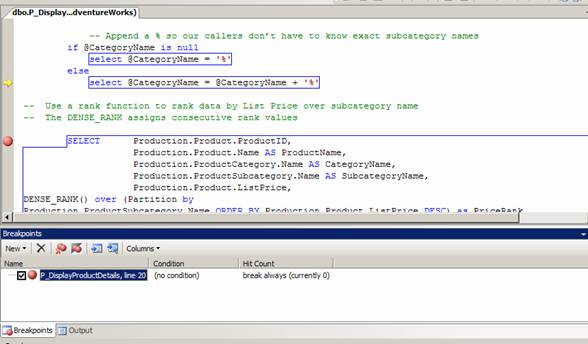 Figure 7: Breakpoints window
Conclusions
Visual Studio 2005 has easy-to-use graphical debugging tools for your T-SQL stored procedures. You may want to take advantage of this when unit testing your code. Since developers typically unit test code in the absence of all supporting cast procedures or functions, the Step Over option could really come in handy. Also, since you can easily change values of input parameters or local variables, you can force your program's flow down paths, which will exercise specific portions of code.
<< Home